I've been learning a bit about heat waves.
The WMO defines heat waves as a sequence of five straight days when the daily maximum temperature exceeds the average maximum temperature by 5 °C. Heat waves can extend much longer than 5 days and can exceed average maximums by much more than 5°C. Although heat waves are a categorical classification, they are part of continuous variation in climate.
Here at Konza, over the past 25 years, there has been a lot of variation in climate. We haven't had a major drought since 1980 (http://en.wikipedia.org/wiki/1980_United_States_heat_wave). One thing I didn't have in my head is when the heat waves come and how hot they can be. With the standard definition of heat waves, heat waves should be equally likely across the year. Yet, if you look at the climate data for Konza, the strongest heat waves happen a bit later in the year than one might think.
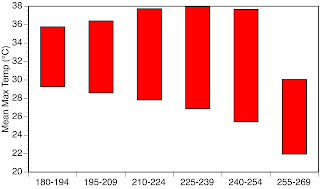
I took the climate data for Konza and averaged the maximum temperature for each day in 15-day periods from early July to early September. It turns out that the hottest mean daily temperatures are in late July (not shown), but the strongest heat waves are in late August.
Here's a graph of the min and max mean daily maximum temperatures for 15-day periods from 1984-2010.
Although the hottest mean temperatures are generally at the end of July (not shown), the greatest heat waves come at the end of August. In 2003, high temps averaged 40°C for 2 weeks in the last two weeks of August.
Ecologically, the interesting questions about heat waves become how plants (and animals) respond to heat waves at different times of year. Most C4 grasses are shutting down in early September. One would think that heat waves at that time of year would have much of an effect compared to ones in July or early August.
At some point, we'll have another summer like 1980. Preparedness is an important topic, but also for ecologists. I wonder if we're measuring the right things so that when it comes around we can understand our ecosystems better.


