Showing posts with label drought. Show all posts

Monday, February 20, 2012

Listening to Weaver

Good example of where drought led to replacement of tallgrass species with more drought-tolerant mixed grass species.  From Weaver and Albertson, 1936. 

John Weaver is considered the father of grassland ecology in North America. Most likely because of his views on succession, quite often he is a forgotten father. Yet, his work on grasslands spanned over 50 years. His work is notable in many ways, but his careful observation of grasslands before, during, and after the Great Drought of the 1930's taught us an immense amount about how grasslands respond and recover to drought.

If you read Weaver's work, there are some hidden lessons about how plant communities respond to drought. Weaver talked about how during the Great Drought, the shortgrass spread hundreds of miles to the east into the mixed grass region and the mixed grass hundreds of miles into the tallgrass. Yet, reading his observations, most of the expansion of xeric grasslands did not occur from migration of individual species, but expansion of local populations. Eventually, when the drought broke the humid grasslands marched back westward, but again through expansion of local populations or dormant propagules. In many cases, big bluestem (Andropogon gerardii) recovered from crowns that remained viable for almost a decade.

These findings from Weaver raises an interesting set of questions about the functional diversity of grasslands and how different grasslands would respond to drought. Essentially, when droughts hit or mean precipitation levels change, how much does ecosystem function depend on expansion of local populations vs. immigration of species?

We tackled this question with some of the data we had on drought tolerance for a global set of grasses. In short, we asked how the diversity of drought tolerance varied bioclimatically. For example, as mean precipitation declines along a gradient, is there a greater relative abundance of drought-tolerant species? Are there fewer drought-intolerant species?

Turns out that across the full range of precipitation that generates grasslands, the diversity of drought tolerance among grasses is high. In wet grasslands, there are still many drought-tolerant grasses. In dry grasslands, there are still many drought-intolerant grasses.

Relationships between the bioclimatic ranges of grass species and physiological drought tolerance (Ψcrit) for 253 grass species. Each species is represented by a horizontal line with the endpoints signifying the 10th and 90th percentile of its occurrence with respect to precipitation after standardizing for differences in temperature. Gray envelope behind species ranges represents smoothed fit for range of drought tolerance (95% of entire range) across the precipitation gradient.

Given a number of assumptions, extrapolating out, almost all grasslands should on average have a broad range of drought tolerance. If precipitation declines, drought-tolerant species on average should be able to expand locally and maintain ecosystem function.

There are still a number of details to work out, but Weaver's description of grasslands seems to hold at the global scale. Functional diversity in grasslands represents the typical high spatial variability in resource availability and the climatic variability typical of grasslands.




Friday, January 27, 2012

The indirect effect of drought on plants


The direct effects of stresses on plants are often fatal (making them disturbances, by definition). For example, drought can cause cavitation in a plant's xylem, which leads to tissue desiccation and ultimately death. But, the indirect effects of stresses can cause mortality, too. Stresses can reduce the defense systems of plants allowing pests and pathogens to kill plants before the direct effects of drought ever do. Direct tests of the generality of this principle are uncommon though.

Jactel et al. recently published a meta-analysis of the effects of drought on damage to trees by insects and pathogens. The results were neat. They found that agents that attack plant leaves were enhanced by water stress to plants. Yet, agents that attack the plant through its wood caused less damage to water-stressed plants than to unstressed plants.

The best part of the paper was linking the degree of water stress to the severity of damage (shown above). Their metric was the reduction in plant water potential relative to the water potential at which conductance is reduced by 50%. The greater the severity of water stress, the greater the damage.

Well done.


Jactel, H., J. Petit, M.-L. Desprez-Loustau, S. Delzon, D. Piou, A. Battisti, and J. Koricheva. 2012. Drought effects on damage by forest insects and pathogens: a meta-analysis. Global Change Biology 18:267-276.

Saturday, January 14, 2012

Why trees die: case example


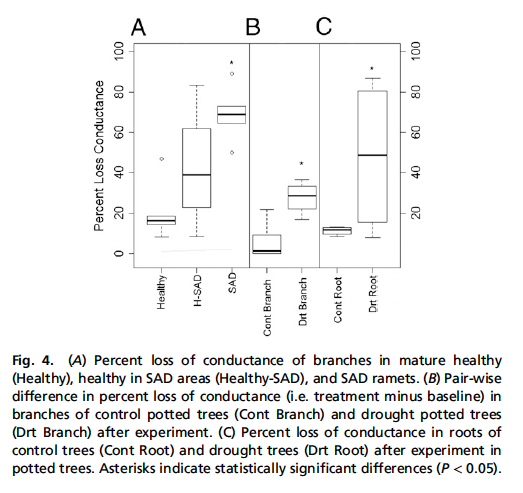
Understanding mortality in plants is a tangle of proximal and distal as well as competing hypotheses. A recent paper in PNAS tried to disentangle a number of issues for understanding mortality in trembling aspen (Populus tremuloides).

The authors use a mix of gradients and experiments to examine patterns of carbohydrate reserves and hydraulic properties for droughted and non-droughted aspen plants. Plants that were droughted and non-healthy did not have reduced carbohydrate levels in their tissues (leaves or roots). In contrast, dying plants consistently were experiencing loss of hydraulic conductance and cavitation.

What is interesting here is that aspen is the lettuce of trees. It is an isohydric, physiologically drought-intolerant species. The research shows that pot experiments should be pretty good at determining the drought tolerance characteristics of species. Screening experiments (and rated, more involved detailed studies like these) should allow for the type and degree of drought tolerance to be assessed for other  species. hence, models of future mortality could be generated for forests across the world.


Anderegg, W. R., J. A. Berry, D. D. Smith, J. S. Sperry, L. D. Anderegg, and C. B. Field. 2012. The roles of hydraulic and carbon stress in a widespread climate-induced forest die-off. Proceedings of the National Academy of Sciences of the United States of America 109:233-237.

Thursday, December 1, 2011

The proximal should precede the distal

Relationship between water potential at which a species loses 90% of conductivity and dry season mortality. From Pratt 2008.  

When it comes to explaining patterns associated with the ecology of plants, a simple dictum should apply: the proximal should precede the distal.

I've been working with a few others to try to make this point with plant functional traits and ecological patterns for a review that Science green-lighted. In short, when looking to explain ecological phenomena, the mechanisms explored should be the closest to the mechanisms that generate the pattern. 

If drought is thought to cause mortality in a system and one is trying to understand which plants would survive drought the best, measure whole-plant drought tolerance first. Then begin to examine more distal underlying traits. Don't start measuring traits like SLA or screening genes until drought tolerance has been quantified.

Pratt et al. 2008 show a good example of the approach. The authors grew up a series of chaparral species from seed and monitored their performance over a dry summer. Those species that could withstand low water potentials the best, suffered lower mortality.

The same approach applies for a range of other cases, but each time it is important to be clear about what the processes are that are hypothesized to generate the patterns of interest and then measure the functional traits that are most closely related to them. 

There has been over-reliance on general leaf traits, for example, that has generated a lot of frustration (and frustratingly low explanatory power). In contrast, when ecologists directly measure the ability of plants to tolerate low resource availability, for example, ecological patterns are explained better.

Defining the pattern of interest, generating hypotheses about their causes, and clearly linking form and function is a heck of a lot harder than going out and measuring SLA. 

Ultimately, when the proximal precedes the distal, more explanation is generated.

We'll see how we do making the case for the proximal in this review.

Monday, September 5, 2011

Drought and stress tolerance

Comparison of photosynthetic rates for seedlings of dry- and wet-habitat tropical tree species. On average, photosynthetic rates were ~1/3rd higher for dry-habitat species. 


I wrote a bit on this just the other day, but here is a new paper that raises questions about whether low-water species should be considered "stress-tolerators". Pineda-Garcia et al. grew seedlings of 10 pairs of closely related tropical tree species and measured a suite of traits. Dry-habitat species had higher photosynthetic rates than wet-habitat species. In addition, dry-habitat species retained their leaves longer after watering was ceased.

There are always a number of ways plasticity can alter relationships. For example, I once showed that high resource species can have lower N concentrations and longer leaf longevity than low-nutrient species due to patterns of feedbacks to N cycling after establishment. Here, there are a number of mechanisms that could generate the higher photosynthetic rates and longer leaf longevity in this particular experiment that could be reversed in another. Parsimony accrues slowly.

Yet, overall, this is another example where drought-tolerant species are not necessarily following the general "stress-tolerator" syndrome. It will be interesting to begin to officially tally the evidence to see whether there is much support for the two to be linked.

Pineda-Garcia, F., H. Paz, and C. Tinoco-Ojanguren. 2011. Morphological and physiological differentiation of seedlings between dry and wet habitats in a tropical dry forest. Plant, Cell & Environment 34:1536-1547.

Monday, August 29, 2011

Drought vs. shade tolerance

The leaf economics spectrum is the modern incarnation of Grime's C-S axis. Without the overarching evolutionary strategies attached, it describes a broad set of correlations that cover species with leaves that have low activity rates, are built tough and live a long time, to those that have high activity rates, are built wimpy, and live a short time.

The evolutionary underpinning of the broad correlations--what ecological forces would select for the correlations--has remained opaque.

Ülo Niinemets has been publishing on this question for a few years. For example, in 2006, he and Valladares compiled rankings of shade and drought tolerance for woody species in the northern continents. The correlation was somewhat weak, but was negative. More importantly it showed that although there were species that had low shade and drought tolerances (x-axis), there were no species with high shade and drought tolerances.


In a follow-up paper, they examined the associations between stress tolerances and functional traits. They concluded that the traits associated with shade tolerance did not consistently have traits associated with stress-tolerance, while drought tolerant species did.

The evidence for drought tolerance being associated with traits that are low on the leaf economics spectrum, though, seemed a lot more mixed when examined individually. For example, across all species the pairwise correlation coefficient was just 0.18 (P <  0.001), which translates to an r2 of 0.04. Plus the relationship was negative for conifers (EC). LMA relationships were all positive and r = 0.3 overall (r2 = 0.09).


What you can see, though, is that most of the leaf economics spectrum are differences between broadleaf deciduous species and evergreen conifers. And these two groups do not differ primarily in terms of drought (or shade) tolerance. Hence, the trait relationships are pretty weak.

They ran a PCA of 4 main leaf economic traits (leaf longevity, %N, LMA, and photosynthetic rate). Overall and within each group, drought tolerant species ranked lower on the leaf economics spectrum. Overall r = 0.29 (P < 0.01).


I'm still working to rectify these results with what we've found for grasses. A few points are important here.

•Drought tolerance scores were rankings derived from observations, and do not necessarily represent physiological drought tolerance.

•The majority of the leaf economics spectrum for trees is associated with broad functional groups, which do not correspond to differences in shade or drought tolerance.

•Shade tolerance was not associated with the LES, mostly because of shade species having low LMA. But this is because shade tolerant species have thin leaves, not because they have low density (a different paper shows this). This also brings up the question whether LMA should be part of the LES [Answer: SLA (and LMA) should R.I.P.--leaf tissue density is much better.]

•If shade tolerance is not associated with the leaf economics spectrum, is drought tolerance? The glass is 10% full here at best.

•For grasses, we just don't see the same results. Drought tolerance is associated with high rates or gas exchange and no difference in leaf tissue density.

Research like this is going to be important for the interpretation of the leaf economic spectrum. Species high on the spectrum probably can be considered modern C species. But what about low? Is there one general stress-tolerant syndrome with variants that correspond to shade-, drought-, and nutrient-stress tolerance? Or are these largely independent of one another, but just never have the traits of high-resource species?

The endpoints definitely form a pyramid. The question is how tall is the pyramid? How different are high resource species from low-water species, compared to low-water to low-nutrient? We'll probably need more than 4 leaf traits to find this out.


Niinemets, U. and F. Valladares. 2006. Tolerance to shade, drought, and waterlogging of temperate Northern Hemisphere trees and shrubs. Ecological Monographs 76:521-547.
Hallik, L., U. Niinemets, and I. J. Wright. 2009. Are species shade and drought tolerance reflected in leaf-level structural and functional differentiation in Northern Hemisphere temperate woody flora? New Phytologist 184:257-274.

Thursday, August 18, 2011

Leaf architecture and physiological drought tolerance


Patterns of physiological drought tolerance and leaf venation architecture among 10 woody species.

Quick note on a new paper.


Scoffoni et al. determined the physiological drought tolerance and architecture of 10 woody species. The authors test key components of leaf venation architecture to understand the underlying leaf structural mechanisms for drought tolerance. Most work on drought tolerance focuses on stems and highlight xylem geometries, but the authors show that the density of veins in a leaf are the best correlate with its physiological tolerance of drought. High vein density provides insurance against embolism and allows water to continue to be supplied to areas adjacent to veins that have experienced embolisms that necessarily accompany low water potentials. 


The authors highlight the need to separate leaf size and vein density, which were correlated in the study. But, the research raises an interesting question as to whether the need for higher vein densities serves as a constraint on leaf size and ultimately contributes to one of the major biogeographic patterns of plant form.


I also think their figure, shown above, is pretty stunning. 


Scoffoni, C., M. Rawls, A. McKown, H. Cochard, and L. Sack. 2011. Decline of leaf hydraulic conductance with dehydration: relationship to leaf size and venation architecture. Plant Physiology 156:832-843.

Tuesday, August 2, 2011

Evolution of drought tolerance

Phylogenetic tree of 165 grasses. Size is bubble is proportional to physiological drought tolerance (big bubble = lower psi-crit).


We know a bit about the ancestor of Poaceae. All the main defining characters of grasses like the parallel venation, the monocotyledon, and the distinctive grass flowers, were present in the ancestral grass. What did the first grassland look like? What about it's ecology? Did grasses start in the shade and come out in the open? Were they from wet soils and evolved to inhabit the dry? 

We don't have a time machine, but we do have the ability to assemble the phylogentic relationships among grasses and infer origins. Steve Kembel helped out and took Erika Edwards phylogeny from her PNAS paper and arrayed physiological drought tolerance data from 165 species from our experiment that matched with her phylogeny.

The first thing that pops out is there is no phylogenetic signal to the data. Drought tolerance pops up throughout the phylogeny. If true--and our dataset is by no means definitive yet--then drought tolerance might be evolutionary labile. It might not take that many mutations to confer physiological drought tolerance.

But what about the ancestral trait? Was the mother of all grasses physiologically drought tolerant? That specific analysis has yet to be run, but likely not. Most of the modern grasses are not terribly drought tolerant and the most parsimonious explanation for that--as I understand it--is that it is more likely that the relatively small fraction of grasses that are super-drought tolerant hold the derived trait.

As they say, watch this space. We're going to try to prove ourselves wrong in the meantime.

Sunday, July 31, 2011

Heat waves and drought: it's all in the timing

Distribution from 1984-2010 of (a) mean daily maximum temperatures averaged over 15-d intervals and (b) soil moisture at 25 cm taken approximately every 15 days. Also shown (c) is the sensitivity to grass aboveground net primary productivity (ANPPG) to variation in drought and heat waves assessed every 15 d in 5-d increments. The critical climate period for drought (day of year 105-214) is shown in blue and for heat waves (day of year 190-214) is shown in red.
July in 2011 has been hot. And dry. Supposedly it's suppose to be like this more often in the future as future climates are likely to include more frequent droughts and heat waves. 

It's generally assumed that in most grasslands these events reduce grass production, yet their effects have been viewed somewhat monolithically. When it comes to forecasting the consequences of future climate variability, droughts and heat waves in early-, mid-, or late-summer are not viewed very differently. Absence of evidence is not necessarily evidence of absence though. 

The Konza LTER has built up datasets over the past 25 years that can really test this, though.

27 years of annual productivity
27 years of daily weather
27 years of daily stream discharge
27 years of biweekly soil moisture
17 years of biweekly productivity
11 years of remotely-sensed NDVI

I'll write about some of the datasets another time, but if one examines the annual productivity data and the climate data together with the critical climate period approach, it is clear that the timing of climate variability is just as important--if not more--than the magnitude.

First, grass productivity only responds to drought (or the converse precipitation) during part of the growing season (Apr 10-Aug 2). Drought in August doesn't reduce primary productivity. 

And heat waves? They only reduce productivity during a 25-d window. Jul 10 - Aug 2. Heat waves in August, no less June, just have no impact on productivity. 

We can use these data to come up with new relationships between productivity and climate variability.


A couple of lessons can be learned here, but the most striking is that droughts and heat waves in August just don't affect grass production. It's not that grasses aren't growing then. About 10% of the production happens then and in some years it can be as high as a third of the mean annual productivity. Yet, growth during that time is not tied to climate then.

It's hard to explain why this is so, but the practical consequences are clear. If droughts or heat waves are more likely to happen in August, it doesn't matter for the amount of grass we have. We've shown elsewhere it still impacts the bison, most likely because they cue in on grass quality than quantity. But ANPP is insensitive. If we  want to predict future productivity well, they we better know timing as well as magnitude.

**On a side note, the results are really the highest expression of what the LTER approach can accomplish. I think long-term datasets have fallen out of fashion in the ecological community. When was the last time Science or Nature published a paper that centered on a long time-series from an LTER site. Compared to experiments, models, and cross-site synthesis, long time series seems like a short leg of the table these days. No one has ever set up an experiment to test what natural variability has shown us about the timing of variability.


Sunday, July 3, 2011

Grasses of the World IV--Taxonomic differences


Relationships between leaf width and physiological drought potential for six genera of grass.


No one know exactly what the ancestral grass looked like or the environments it inhabited. But one could imagine a bright, open wet environment with a narrow leaved bunch grass or weakly rhizomatous grass inhabiting it.  Some tens of millions of years later the BEP and PACMAD clades would have diverged and the major radiations of grasses still a long way off. 

But what were the forces that drove the radiations. Aridity is often cited as one. Fire another. Grazers still a third. But this might be somewhat of a skewed, biased perspective, since there has been little work to characterize the modern ecology of the whole of grasses.

When we look at the global traitscape of grasses, we saw clear patterns for leaf width and drought tolerance. One can imagine some selective force favoring wide-leaved grasses and drought narrow leaved grasses, until an ecological or physiological tradeoff was reached.

But what does the pattern of radiations for individual clades look like?

If I map the distribution of 6 genera in traitspace, clear unique patterns show up. The genus Panicum, for example, has species with wide and narrow leaves, but none that are very drought tolerant. In contrast, Festuca species all have leaves that are narrow, but span the full range of drought tolerance.

We still haven't mapped all this onto a phylogenetic tree. That's coming. But the value of screening programs like this are pretty clear for understanding the ecology and evolution of grasses. 

But why the separation among genera? Are individual genera constrained physiologically, or are they constrained evolutionarily by the presence of other species that lead to the apparent differentiations. 

Part of what we still need to do is understand the importance of traits such as leaf width and understand the benefits (and constraints) of narrow and wide leaves.

Traitscape of drought tolerance for Konza

One of the keys to understanding community assembly will be assembling traitscapes for communities and comparing them to global traitscapes. Earlier, I showed how we could assemble a nitrogen traitscape for Konza and compare that to the global distribution to show that the typical Konza species has higher foliar N concentrations and experiences higher N availability than the typical species at the global scale.

We're getting close to being able to do something similar for Konza, but for physiological drought tolerance. We're working to collect all the grass species of Konza and measure their psi-crit in order to compare them to the global distribution. We've only fully measured 28 of Konza's 86 species of grasses, but the patterns so far our interesting.

Part of the power of the traitscape is to understand inter- vs. intra-site importance of environmental variation. For drought, if we expect Konza to be more likely to experience frequent and severe drought than other grasslands of the world, you could expect to see the typical species be more drought tolerant than the global distribution. We can also look at the distribution of drought tolerance at a site and see how that compares to the global range. Means might be different, but if there is high spatial or temporal variability in water availability, a community could encompass a large part of the global range.

Expectations for Konza are a bit uncertain--it's a humid prairie (835 mm y-1 precip), but can experience severe droughts. Within site, there are dry habitats--south facing slopes with thin soils--and wet ones--seeps, riparian areas, and ditches.

The pattern?

So far the global mean psi-crit is -4.8 MPa. Konza? -4.5 MPa.

The global range is -1.4 to <-14 MPa. Konza? -1.8 to -13 MPa.

Here's the pattern of psicrit with leaf width (red = Konza species):


After 28 species, most of the global trait-space is covered. If anything, Konza might be underrepresented in fine-leaved, drought tolerant grasses. I haven't measured Agrostis hyemalis yet, but it's leaves are about 1mm across--we'll see how drought tolerant it is.

I think there's an amazing range of diversity in drought tolerance at a single site. Konza might be an exception, but the diversity in soil moisture availability at a site can be high.

One question that comes up is that if there can be such high diversity at a site, what are the differences in among sites? How important is drought tolerance in differentiating grasslands and contributing to gamma diversity?

Saturday, July 2, 2011

Grasses of the world III--grasses can be incredibly drought tolerant

I've posted that I've been growing up 500 grass species from around the world to look at the geographic and phylogenetic distribution of physiological drought tolerance. Before we learned we were a bit constrained in quantifying the drought tolerance of grasses because we had grasses that could withstand pressures in excess of our previous pressure bomb, which maxed out at 10 MPa (~1450 psi). Jeff Hamel at PMS Instruments sent us one that goes to 14 MPa (~2000 psi). With that, we've rerun some grasses and measured some new ones, while we wait for some others to grow from seed again.

Still, the first results show that there are grasses that are incredibly drought tolerant.

We've now measured physiological drought tolerance (psi-crit) on 398 species. 13 of those were able to conduct water at pressures in excess of -14 MPa. That's more than 3% of the grasses we surveyed.


3% does not seem like a large number, but that number will only go up as we measure the most drought-tolerant species which are regrowing. 5% might not seem that high, but that'd be 500 species of grasses in the world if you extrapolate out. 

How drought tolerant could some of these species be? If you extrapolate out the lower bound of the width-psicrit relationship, we should have some that hit -17 MPa (~2500 psi).


Saturday, June 4, 2011

Heat waves

I've been learning a bit about heat waves.

The WMO defines heat waves as a sequence of five straight days when the daily maximum temperature exceeds the average maximum temperature by 5 °C. Heat waves can extend much longer than 5 days and can exceed average maximums by much more than 5°C. Although heat waves are a categorical classification, they are part of continuous variation in climate.

Here at Konza, over the past 25 years, there has been a lot of variation in climate. We haven't had a major drought since 1980 (http://en.wikipedia.org/wiki/1980_United_States_heat_wave). One thing I didn't have in my head is when the heat waves come and how hot they can be. With the standard definition of heat waves, heat waves should be equally likely across the year. Yet, if you look at the climate data for Konza, the strongest heat waves happen a bit later in the year than one might think.

I took the climate data for Konza and averaged the maximum temperature for each day in 15-day periods from early July to early September. It turns out that the hottest mean daily temperatures are in late July (not shown), but the strongest heat waves are in late August.

Here's a graph of the min and max mean daily maximum temperatures for 15-day periods from 1984-2010.

Although the hottest mean temperatures are generally at the end of July (not shown), the greatest heat waves come at the end of August. In 2003, high temps averaged 40°C for 2 weeks in the last two weeks of August.

Ecologically, the interesting questions about heat waves become how plants (and animals) respond to heat waves at different times of year. Most C4 grasses are shutting down in early September. One would think that heat waves at that time of year would have much of an effect compared to ones in July or early August.

At some point, we'll have another summer like 1980. Preparedness is an important topic, but also for ecologists. I wonder if we're measuring the right things so that when it comes around we can understand our ecosystems better.

Drought tolerance: grasses of the world II

After 200 species, there still is a boundary between width and drought tolerance, just with a missing corner.

I haven't seen too many reviews of drought tolerance/cavitation resistance of grasses, but it is generally thought that permanent wilting points for most grasses is about -3MPa. It isn't considered that too many plants can resist below -10 MPa. Why -10 MPa? Because the machines to measure water potential don't go below there.

In the past few weeks, I've continued to measure the drought tolerance of grasses from across the world.
As the species have accumulated, the same tradeoff boundary observed earlier appears to hold. Yet, over 10% of the species appear to be able to conduct water at pressures below -10 MPa. For reference, if you could graft any of these species on the top of the tallest redwood, they could still conduct water.

We still need to nail down the actual psi-crits for the species. The problem is that our pressure bomb stops at -10MPa (100 bar).


The good news is that Jeff Hamel at PMS has been kind enough to build one that goes to -14MPa, which should allow us to determine the drought tolerance of the most drought-tolerant grasses. We'll grow up these species again and let them dry down. Hopefully, Jeff won't have to build one that goes below -14 MPa.

Saturday, May 14, 2011

Drought tolerance: grasses of the world


One of the 500 species that are part of the Poa500 project to examine drought tolerance in grasses of the world.
I'm not sure this one is going to work. I believe that if you measure something interesting and have strong contrasts, you should learn something interesting. I've had pretty crazy schemes work out in the past. Hopped on a plane and measured roots on three continents. Had people send me soil from across the US to look at nutrient limitation. Measured foliar 15N for a couple hundred species at Konza. Even looked at spectroscopic assays of 20,000 cow poop samples to infer continental scale patterns of forage quality.

Each time, we learned something interesting by having strong contrasts and measuring something interesting. But to start to understand global patterns of drought tolerance by growing 500 species of grass in the growth chamber in relatively tiny tubes? I'm just not sure this one is going to work. 

Granted, what we're doing right now is just a pilot project and would be easier with the NSF Dimensions of Biodiversity grant funded. But, questions about the evolution and geographic distribution of drought tolerance are just too important not too try. At the heart of it, we just don't understand the traits that are associated with drought tolerance--what does a drought-tolerant plant consistently look like. In what climates are they most likely to be found. Are some lineages more likely to have evolved drought tolerance than others?

To begin to answer the question, USDA sent me seeds for 500 grass species from their seedbanks and I've serially germinated them over the past 2 months. After about a month, we measure a couple of gas exchange and morphological metrics on the leaves and then stop watering. When they stop conducting water (shut their stomata), we measure their water potential, which we call psi-crit.

A little over 100 species have hit their psi-crit so far. Here's probably the most interesting graph so far--drought tolerance (psi-crit) vs. the maximum width of the largest leaf on the plant. 


It seems like you can have narrow leaves on plants that aren't drought tolerant--species like Enneapogon oblongus. You can also have narrow leaves on plants that are drought tolerant--species like Bouteloua repens. You can also have wide leaves on plants that are not drought tolerant--species like Dichanthelium scoparium. But you can't have wide leaves on plants that are drought tolerant. Doesn't exist.

Of course, it doesn't take more than one species to prove something not impossible.

We still have a few species left to measure, of course.

Friday, January 14, 2011

How to infer importance

Quantifying the relative importance of ecological factors in determining the distribution and abundance of species is one of the most critical endeavors to understand the assembly of communities and ultimately the evolution of different species. Yet, how do we do this?

One approach is experiments. Another is gradient analyses. Each has its pluses and minuses. Yet, is there a way to infer importance without manipulations or gradients. If I go to a single place and determine who is rare and who is abundant, does that offer insight?

Seems like it should.

Let's take drought. Drought has long thought to structure grasslands. We know that it can from the Great Drought. But how important is drought in determining the assembly of extant communities?

One way is to compare a trait that should confer advantage during drought to the relative abundance of species currently. But what are the interpretations of the relationships. Let's say there is a positive relationship between the drought tolerance trait and abundance. Probably good evidence that drought structures the community since those species that do not have the trait are less abundant.

But what if there is no relationship? Does this mean drought is not important since it doesn't confer any net advantage? Or is it equally important as some other factor, since one might expect the drought tolerance trait to penalize plants in wet times? And what if physiologically drought-tolerant species are less abundant than intolerant ones? Is drought not important? Or does drought serve as a disturbance and structure the community in a different way.

In all, using an inferential approach to interpret patterns depends strongly on our mental model of how different factors structure communities. As much as being able to measure the right traits, linking these mental models to testable hypotheses is one of the most limiting steps.

In short, we need to spend more time clarifying our concepts before testing the importance of factors.

Thursday, January 8, 2009

Drought and isohydry

I recently had the chance to read "Mechanisms of plant survival and mortality during drought: why do some plants survive while others succumb to drought?", which is a Tansley review in New Phytologist by Nate McDowell and others. One thing I really liked about their paper was the dichotomy between two potential strategies for coping with drought. The anisohydry strategy has plants experiencing lower leaf water potential as soils dry, but maintaining photosynthesis and transpiration throughout the drought. These plants are typical "low-water" species with all the anatomical traits that resist cavitation. The other strategy is to avoid drought through stomatal closure, maintaining more constant leaf water potentials. This is termed an isohydric strategy.

The latter strategy is interesting in that "drought-avoidance" is usually considered to be associated with little ability to withstand drought causing plants to die back or complete a generation until drought is relieved. Instead of the succulent strategy, where plants store water, the isohydry strategy requires plants to store carbon.

The paper is intriguing and I have a few questions about the generality of the isohydry strategy. Here are two:

1) It isn't clear that many species with low psi-crit's store a lot of C to endure drought. For example, I can't think of many herbaceous grassland species that use stored carbon to maintain a plant after leaves have closed their stomata.

2) After plants close their stomata, as soils continue to dry, plant water still comes under increasing tension, unless plants can hydraulically isolate themselves from the soil. The authors allude to this, but I'm not sure I understand how viable a strategy it is to close your stomates and wait for rain. Are plants more likely to run out of carbon before they cavitate? 

A lot of plants have big carbon stores that we don't know when they are used. This might explain some of those patterns.

Good job to the authors on the paper. It'll be interesting to see the ideas developed more and the hypotheses tested in other systems.